|
600
|
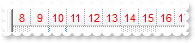
How can I display minutes
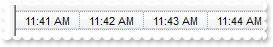
with G2antt1 do
begin
	Chart.LevelCount := 2;
	Chart.UnitWidth := 64;
	Chart.Level[0].Label := OleVariant(65536);
	Chart.Level[1].Label := OleVariant(1048576);
end
|
|
599
|
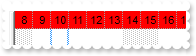
How can I display seconds, from 15 to 15
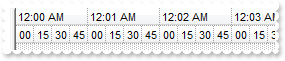
with G2antt1 do
begin
	Chart.FirstVisibleDate := '00:00';
	Chart.LevelCount := 2;
	Chart.Level[0].Label := OleVariant(1048576);
	with Chart.Level[1] do
	begin
		Label := '<%ss%>';
		Count := 15;
	end;
end
|
|
598
|
How can I display seconds
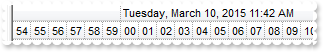
with G2antt1 do
begin
	Chart.LevelCount := 2;
	Chart.Level[0].Label := OleVariant(1048576);
	Chart.Level[1].Label := '<%ss%>';
end
|
|
597
|
How can I display seconds
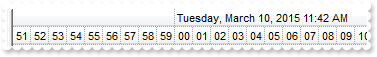
with G2antt1 do
begin
	Chart.LevelCount := 2;
	Chart.Level[0].Label := OleVariant(1048576);
	Chart.Level[1].Label := OleVariant(16777216);
end
|
|
596
|
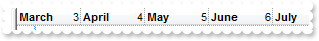
How can I align the text being shown in the chart's header
with G2antt1 do
begin
	Chart.UnitWidth := 64;
	with Chart.Level[0] do
	begin
		Label := '<b><%mmmm%></b> <r><%m%>';
		Unit := EXG2ANTTLib_TLB.exMonth;
		Alignment := EXG2ANTTLib_TLB.LeftAlignment;
	end;
end
|
|
595
|
How can I hide the tooltip being displayed in the chart's header
with G2antt1 do
begin
	Chart.Level[0].ToolTip := '';
end
|
|
594
|
How can I change the tooltip being displayed in the chart's header
with G2antt1 do
begin
	Chart.Level[0].ToolTip := 'This is a bit of text that''s shown when the cursor hovers the level';
end
|
|
593
|
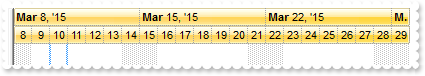
How can I change the visual appearance of the chart's header, where levels are displayed, using your EBN files
with G2antt1 do
begin
	VisualAppearance.Add(1,'c:\exontrol\images\normal.ebn');
	Chart.LevelCount := 2;
	Chart.BackColorLevelHeader := $1000000;
end
|
|
592
|
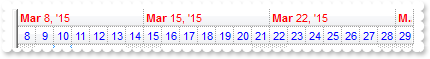
How can I change the level's foreground color in the chart
with G2antt1 do
begin
	Chart.LevelCount := 2;
	Chart.Level[0].ForeColor := $ff;
	Chart.Level[1].ForeColor := $ff0000;
end
|
|
591
|
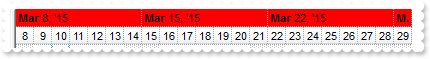
How can I change the level's background color in the chart
with G2antt1 do
begin
	Chart.LevelCount := 2;
	Chart.Level[0].BackColor := $ff;
end
|
|
590
|
How can I save data on XML format
with G2antt1 do
begin
	LoadXML('http://www.exontrol.net/testing.xml');
	SaveXML('c:/temp/exg2antt.xml');
end
|
|
589
|
How can I load data on XML format
with G2antt1 do
begin
	LoadXML('http://www.exontrol.net/testing.xml');
end
|
|
588
|
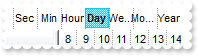
How can I add icons or pictures to the scale or zoom area
with G2antt1 do
begin
HTMLPicture['pic1'] := 'c:\exontrol\images\zipdisk.gif';
Images('gBJJgBAIDAAGAAEAAQhYAf8Pf4hh0QihCJo2AEZjQAjEZFEaIEaEEaAIAkcbk0olUrlktl0vmExmUzmk1m03nE5nU7nk9n0/oFBoVDolFo1HpFJpVLplNp1PqFRqVTql' +
'Vq1XrFZrVbrldr1fsFhsVjslls1ntFptVrtltt1vuFxuVzul1u13vF5vV7vl9v1/wGBwWDwmFw2HxGJxWLxmNx0xiFdyOTh8Tf9ZymXx+QytcyNgz8r0OblWjyWds+m0' +
'ka1Vf1ta1+r1mos2xrG2xeZ0+a0W0qOx3GO4NV3WeyvD2XJ5XL5nN51aiw+lfSj0gkUkAEllHanHI5j/cHg8EZf7w8vl8j4f/qfEZeB09/vjLAB30+kZQAP/P5/H6/yN' +
'AOAEAwCjMBwFAEDwJBMDwLBYAP2/8Hv8/gAGAD8LQs9w/nhDY/oygIA=');
with Chart do
begin
OverviewHeight := 48;
OverviewVisible := EXG2ANTTLib_TLB.exOverviewShowAllVisible;
AllowOverviewZoom := EXG2ANTTLib_TLB.exZoomOnRClick;
OverviewZoomCaption := 'Year|�Year|�Year|<img>3</img> Week|Third|<img>2</img> Day|<img>pic1</img>|Hour|Min|Sec';
Label[EXG2ANTTLib_TLB.exYear] := '';
Label[EXG2ANTTLib_TLB.exHalfYear] := '';
Label[EXG2ANTTLib_TLB.exQuarterYear] := '';
Label[EXG2ANTTLib_TLB.exThirdMonth] := '';
Label[EXG2ANTTLib_TLB.exHour] := '';
Label[EXG2ANTTLib_TLB.exMinute] := '';
Label[EXG2ANTTLib_TLB.exSecond] := '';
OverviewZoomUnit := 52;
end;
Columns.Add('');
with Items do
begin
CellSingleLine[OleVariant(AddItem('Right click the Overview area and select a new scale')),OleVariant(0)] := EXG2ANTTLib_TLB.exCaptionWordWrap;
end;
end
|
|
587
|
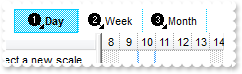
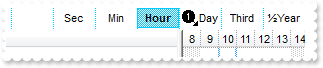
How can I add icons or pictures to the scale or zoom area
with G2antt1 do
begin
HTMLPicture['pic1'] := 'c:\exontrol\images\zipdisk.gif';
Images('gBJJgBAIDAAGAAEAAQhYAf8Pf4hh0QihCJo2AEZjQAjEZFEaIEaEEaAIAkcbk0olUrlktl0vmExmUzmk1m03nE5nU7nk9n0/oFBoVDolFo1HpFJpVLplNp1PqFRqVTql' +
'Vq1XrFZrVbrldr1fsFhsVjslls1ntFptVrtltt1vuFxuVzul1u13vF5vV7vl9v1/wGBwWDwmFw2HxGJxWLxmNx0xiFdyOTh8Tf9ZymXx+QytcyNgz8r0OblWjyWds+m0' +
'ka1Vf1ta1+r1mos2xrG2xeZ0+a0W0qOx3GO4NV3WeyvD2XJ5XL5nN51aiw+lfSj0gkUkAEllHanHI5j/cHg8EZf7w8vl8j4f/qfEZeB09/vjLAB30+kZQAP/P5/H6/yN' +
'AOAEAwCjMBwFAEDwJBMDwLBYAP2/8Hv8/gAGAD8LQs9w/nhDY/oygIA=');
with Chart do
begin
OverviewHeight := 48;
OverviewVisible := EXG2ANTTLib_TLB.exOverviewShowAllVisible;
AllowOverviewZoom := EXG2ANTTLib_TLB.exAlwaysZoom;
OverviewZoomCaption := 'Year|�Year|�Year|<img>3</img> Week|Third|<img>2</img> Day|<img>pic1</img>|Hour|Min|Sec';
Label[EXG2ANTTLib_TLB.exYear] := '';
Label[EXG2ANTTLib_TLB.exHalfYear] := '';
Label[EXG2ANTTLib_TLB.exQuarterYear] := '';
Label[EXG2ANTTLib_TLB.exThirdMonth] := '';
Label[EXG2ANTTLib_TLB.exHour] := '';
Label[EXG2ANTTLib_TLB.exMinute] := '';
Label[EXG2ANTTLib_TLB.exSecond] := '';
OverviewZoomUnit := 52;
end;
end
|
|
586
|
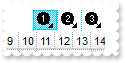
How can I change the width of the unit in the scale or zoom
with G2antt1 do
begin
Images('gBJJgBAIDAAGAAEAAQhYAf8Pf4hh0QihCJo2AEZjQAjEZFEaIEaEEaAIAkcbk0olUrlktl0vmExmUzmk1m03nE5nU7nk9n0/oFBoVDolFo1HpFJpVLplNp1PqFRqVTql' +
'Vq1XrFZrVbrldr1fsFhsVjslls1ntFptVrtltt1vuFxuVzul1u13vF5vV7vl9v1/wGBwWDwmFw2HxGJxWLxmNx0xiFdyOTh8Tf9ZymXx+QytcyNgz8r0OblWjyWds+m0' +
'ka1Vf1ta1+r1mos2xrG2xeZ0+a0W0qOx3GO4NV3WeyvD2XJ5XL5nN51aiw+lfSj0gkUkAEllHanHI5j/cHg8EZf7w8vl8j4f/qfEZeB09/vjLAB30+kZQAP/P5/H6/yN' +
'AOAEAwCjMBwFAEDwJBMDwLBYAP2/8Hv8/gAGAD8LQs9w/nhDY/oygIA=');
with Chart do
begin
OverviewVisible := EXG2ANTTLib_TLB.exOverviewShowAllVisible;
AllowOverviewZoom := EXG2ANTTLib_TLB.exAlwaysZoom;
OverviewZoomCaption := 'Year|�Year|�Year|<img>3</img>|Third|<img>2</img>|<img>1</img>|Hour|Min|Sec';
Label[EXG2ANTTLib_TLB.exYear] := '';
Label[EXG2ANTTLib_TLB.exHalfYear] := '';
Label[EXG2ANTTLib_TLB.exQuarterYear] := '';
Label[EXG2ANTTLib_TLB.exThirdMonth] := '';
Label[EXG2ANTTLib_TLB.exHour] := '';
Label[EXG2ANTTLib_TLB.exMinute] := '';
Label[EXG2ANTTLib_TLB.exSecond] := '';
OverviewZoomUnit := 24;
end;
end
|
|
585
|
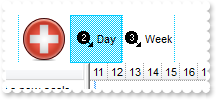
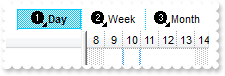
How can I a scale or zoom of the chart, when right clicking the chart's header
with G2antt1 do
begin
Images('gBJJgBAIDAAGAAEAAQhYAf8Pf4hh0QihCJo2AEZjQAjEZFEaIEaEEaAIAkcbk0olUrlktl0vmExmUzmk1m03nE5nU7nk9n0/oFBoVDolFo1HpFJpVLplNp1PqFRqVTql' +
'Vq1XrFZrVbrldr1fsFhsVjslls1ntFptVrtltt1vuFxuVzul1u13vF5vV7vl9v1/wGBwWDwmFw2HxGJxWLxmNx0xiFdyOTh8Tf9ZymXx+QytcyNgz8r0OblWjyWds+m0' +
'ka1Vf1ta1+r1mos2xrG2xeZ0+a0W0qOx3GO4NV3WeyvD2XJ5XL5nN51aiw+lfSj0gkUkAEllHanHI5j/cHg8EZf7w8vl8j4f/qfEZeB09/vjLAB30+kZQAP/P5/H6/yN' +
'AOAEAwCjMBwFAEDwJBMDwLBYAP2/8Hv8/gAGAD8LQs9w/nhDY/oygIA=');
with Chart do
begin
OverviewVisible := EXG2ANTTLib_TLB.exOverviewShowAllVisible;
AllowOverviewZoom := EXG2ANTTLib_TLB.exZoomOnRClick;
OverviewZoomCaption := 'Year|�Year|�Year|<img>3</img>Month|Third|<img>2</img>Week|<img>1</img>Day|Hour|Min|Sec';
Label[EXG2ANTTLib_TLB.exYear] := '';
Label[EXG2ANTTLib_TLB.exHalfYear] := '';
Label[EXG2ANTTLib_TLB.exQuarterYear] := '';
Label[EXG2ANTTLib_TLB.exThirdMonth] := '';
Label[EXG2ANTTLib_TLB.exHour] := '';
Label[EXG2ANTTLib_TLB.exMinute] := '';
Label[EXG2ANTTLib_TLB.exSecond] := '';
OverviewZoomUnit := 64;
end;
Columns.Add('');
with Items do
begin
CellSingleLine[OleVariant(AddItem('Right click the Overview area and select a new scale')),OleVariant(0)] := EXG2ANTTLib_TLB.exCaptionWordWrap;
end;
end
|
|
584
|
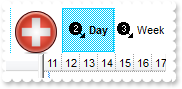
How can I a customize the scale or zoom of the chart
with G2antt1 do
begin
Images('gBJJgBAIDAAGAAEAAQhYAf8Pf4hh0QihCJo2AEZjQAjEZFEaIEaEEaAIAkcbk0olUrlktl0vmExmUzmk1m03nE5nU7nk9n0/oFBoVDolFo1HpFJpVLplNp1PqFRqVTql' +
'Vq1XrFZrVbrldr1fsFhsVjslls1ntFptVrtltt1vuFxuVzul1u13vF5vV7vl9v1/wGBwWDwmFw2HxGJxWLxmNx0xiFdyOTh8Tf9ZymXx+QytcyNgz8r0OblWjyWds+m0' +
'ka1Vf1ta1+r1mos2xrG2xeZ0+a0W0qOx3GO4NV3WeyvD2XJ5XL5nN51aiw+lfSj0gkUkAEllHanHI5j/cHg8EZf7w8vl8j4f/qfEZeB09/vjLAB30+kZQAP/P5/H6/yN' +
'AOAEAwCjMBwFAEDwJBMDwLBYAP2/8Hv8/gAGAD8LQs9w/nhDY/oygIA=');
with Chart do
begin
OverviewVisible := EXG2ANTTLib_TLB.exOverviewShowAllVisible;
AllowOverviewZoom := EXG2ANTTLib_TLB.exAlwaysZoom;
OverviewZoomCaption := 'Year|�Year|�Year|<img>3</img>Month|Third|<img>2</img>Week|<img>1</img>Day|Hour|Min|Sec';
Label[EXG2ANTTLib_TLB.exYear] := '';
Label[EXG2ANTTLib_TLB.exHalfYear] := '';
Label[EXG2ANTTLib_TLB.exQuarterYear] := '';
Label[EXG2ANTTLib_TLB.exThirdMonth] := '';
Label[EXG2ANTTLib_TLB.exHour] := '';
Label[EXG2ANTTLib_TLB.exMinute] := '';
Label[EXG2ANTTLib_TLB.exSecond] := '';
OverviewZoomUnit := 64;
end;
end
|
|
583
|
How can I a scale or zoom the chart at runtime
with G2antt1 do
begin
Images('gBJJgBAIDAAGAAEAAQhYAf8Pf4hh0QihCJo2AEZjQAjEZFEaIEaEEaAIAkcbk0olUrlktl0vmExmUzmk1m03nE5nU7nk9n0/oFBoVDolFo1HpFJpVLplNp1PqFRqVTql' +
'Vq1XrFZrVbrldr1fsFhsVjslls1ntFptVrtltt1vuFxuVzul1u13vF5vV7vl9v1/wGBwWDwmFw2HxGJxWLxmNx0xiFdyOTh8Tf9ZymXx+QytcyNgz8r0OblWjyWds+m0' +
'ka1Vf1ta1+r1mos2xrG2xeZ0+a0W0qOx3GO4NV3WeyvD2XJ5XL5nN51aiw+lfSj0gkUkAEllHanHI5j/cHg8EZf7w8vl8j4f/qfEZeB09/vjLAB30+kZQAP/P5/H6/yN' +
'AOAEAwCjMBwFAEDwJBMDwLBYAP2/8Hv8/gAGAD8LQs9w/nhDY/oygIA=');
with Chart do
begin
OverviewVisible := EXG2ANTTLib_TLB.exOverviewShowAllVisible;
AllowOverviewZoom := EXG2ANTTLib_TLB.exAlwaysZoom;
OverviewZoomCaption := '�Year|�Year|<img>3</img>Month|Third|<img>2</img>Week|<img>1</img>Day|Hour|Min|Sec';
end;
end
|
|
582
|
How can I a scale or zoom the chart at runtime
with G2antt1 do
begin
	with Chart do
	begin
		OverviewVisible := EXG2ANTTLib_TLB.exOverviewShowAllVisible;
		AllowOverviewZoom := EXG2ANTTLib_TLB.exAlwaysZoom;
		OverviewZoomUnit := 24;
	end;
end
|
|
581
|
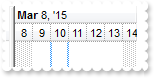
How can I a programmatically select a date
with G2antt1 do
begin
	Chart.MarkSelectDateColor := $ff;
	Chart.SelectLevel := 0;
	Chart.FirstVisibleDate := '1/1/2001';
	Chart.SelectDate['1/2/2001'] := True;
	Chart.SelectDate['1/5/2001'] := True;
end
|
|
580
|
How can I change the color to select a date, when clicking the chart's header
with G2antt1 do
begin
	Chart.BackColor := $ffffff;
	Chart.MarkSelectDateColor := $ff;
end
|
|
579
|
How can I enable or disable selecting a date, when clicking the chart's header
with G2antt1 do
begin
	Chart.BackColor := $ffffff;
	Chart.MarkSelectDateColor := $ffffff;
end
|
|
578
|
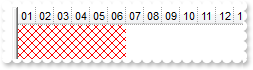
How can I specify the color or the stype for non working hours
with G2antt1 do
begin
	Chart.UnitScale := EXG2ANTTLib_TLB.exHour;
	Chart.PaneWidth[False] := 0;
	Chart.NonworkingHours := 127;
	Chart.NonworkingHoursPattern := EXG2ANTTLib_TLB.exPatternYard;
	Chart.NonworkingHoursColor := $ff;
end
|
|
577
|
How can I specify the pattern or the stype for non working hours
with G2antt1 do
begin
	Chart.UnitScale := EXG2ANTTLib_TLB.exHour;
	Chart.PaneWidth[False] := 0;
	Chart.NonworkingHours := 127;
	Chart.NonworkingHoursPattern := EXG2ANTTLib_TLB.exPatternDiagCross;
end
|
|
576
|
How can I specify the non working hours
with G2antt1 do
begin
	Chart.UnitScale := EXG2ANTTLib_TLB.exHour;
	Chart.PaneWidth[False] := 0;
	Chart.NonworkingHours := 127;
end
|
|
575
|
How can I get the index of the level from the point or cursor
with G2antt1 do
begin
	var_LevelFromPoint := Chart.LevelFromPoint[0,0];
end
|
|
574
|
How can I get the link from the point or cursor
with G2antt1 do
begin
	var_LinkFromPoint := Chart.LinkFromPoint[0,0];
end
|
|
573
|
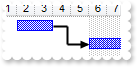
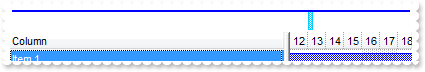
How can I disable or enable at runtime linking the bars
with G2antt1 do
begin
	Chart.AllowLinkBars := True;
	Chart.FirstVisibleDate := '1/1/2001';
	Columns.Add('Column');
	with Items do
	begin
		AddBar(AddItem('Item 1'),'Task','1/2/2001','1/4/2001','B1',Null);
		AddBar(AddItem('Item 2'),'Task','1/6/2001','1/14/2001','B2',Null);
	end;
end
|
|
572
|
How can I check or verify if a date is a non working day
with G2antt1 do
begin
	Chart.FirstVisibleDate := '1/1/2001';
	Columns.Add(G2antt1.Chart.IsNonworkingDate['1/1/2001',Null]);
end
|
|
571
|
How can I check or verify if a date fits the chart's visible area
with G2antt1 do
begin
	Chart.FirstVisibleDate := '1/1/2001';
	Columns.Add(G2antt1.Chart.IsDateVisible['1/1/2001']);
end
|
|
570
|
How can I add a remove all non working days
with G2antt1 do
begin
	Chart.NonworkingDays := 0;
	Chart.FirstVisibleDate := '1/1/2001';
	Chart.AddNonworkingDate('1/1/2001');
	Chart.ClearNonworkingDates();
end
|
|
569
|
How can I add a remove a non working days
with G2antt1 do
begin
	Chart.NonworkingDays := 0;
	Chart.FirstVisibleDate := '1/1/2001';
	Chart.AddNonworkingDate('1/1/2001');
	Chart.RemoveNonworkingDate('1/1/2001');
end
|
|
568
|
How can I add a custom non working days
with G2antt1 do
begin
	Chart.NonworkingDays := 0;
	Chart.FirstVisibleDate := '1/1/2001';
	Chart.AddNonworkingDate('1/1/2001');
	Chart.AddNonworkingDate('1/5/2001');
end
|
|
567
|
How can hide the non working days
with G2antt1 do
begin
	Chart.ShowNonworkingDates := False;
end
|
|
566
|
How can hide the non working days
with G2antt1 do
begin
	Chart.NonworkingDays := 0;
end
|
|
565
|
How can I let user adds new bars at runtime
with G2antt1 do
begin
	Chart.AllowCreateBar := EXG2ANTTLib_TLB.exCreateBarAuto;
	Columns.Add('Column');
	with Items do
	begin
		AddItem('Item 1');
		AddItem('Item 2');
	end;
end
|
|
564
|
How can I change the width of the links between bars
with G2antt1 do
begin
	Chart.LinksStyle := EXG2ANTTLib_TLB.exLinkSolid;
	Chart.LinksWidth := 2;
	Chart.FirstVisibleDate := '1/1/2001';
	Columns.Add('Column');
	with Items do
	begin
		AddBar(AddItem('Item 1'),'Task','1/2/2001','1/4/2001','B1',Null);
		AddBar(AddItem('Item 2'),'Task','1/6/2001','1/14/2001','B2',Null);
		AddLink('L1',FindItem['Item 1',OleVariant(0),Null],'B1',FindItem['Item 2',OleVariant(0),Null],'B2');
	end;
end
|
|
563
|
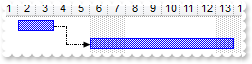
How can I change the style for the links between bars
with G2antt1 do
begin
	Chart.LinksStyle := EXG2ANTTLib_TLB.exLinkDashDotDot;
	Chart.FirstVisibleDate := '1/1/2001';
	Columns.Add('Column');
	with Items do
	begin
		AddBar(AddItem('Item 1'),'Task','1/2/2001','1/4/2001','B1',Null);
		AddBar(AddItem('Item 2'),'Task','1/6/2001','1/14/2001','B2',Null);
		AddLink('L1',FindItem['Item 1',OleVariant(0),Null],'B1',FindItem['Item 2',OleVariant(0),Null],'B2');
	end;
end
|
|
562
|
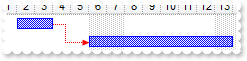
How can I change the color for the links between bars
with G2antt1 do
begin
	Chart.LinksColor := $ff;
	Chart.FirstVisibleDate := '1/1/2001';
	Columns.Add('Column');
	with Items do
	begin
		AddBar(AddItem('Item 1'),'Task','1/2/2001','1/4/2001','B1',Null);
		AddBar(AddItem('Item 2'),'Task','1/6/2001','1/14/2001','B2',Null);
		AddLink('L1',FindItem['Item 1',OleVariant(0),Null],'B1',FindItem['Item 2',OleVariant(0),Null],'B2');
	end;
end
|
|
561
|
How can I hide the links between bars
with G2antt1 do
begin
	Chart.FirstVisibleDate := '1/1/2001';
	Columns.Add('Column');
	with Items do
	begin
		AddBar(AddItem('Item 1'),'Task','1/2/2001','1/4/2001','B1',Null);
		AddBar(AddItem('Item 2'),'Task','1/6/2001','1/14/2001','B2',Null);
		AddLink('L1',FindItem['Item 1',OleVariant(0),Null],'B1',FindItem['Item 2',OleVariant(0),Null],'B2');
	end;
	Chart.ShowLinks := EXG2ANTTLib_TLB.exHideLinks;
end
|
|
560
|
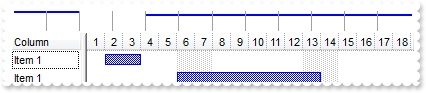
How can I display some grid line in the overview area
with G2antt1 do
begin
	Chart.OverviewVisible := EXG2ANTTLib_TLB.exOverviewShowAllVisible;
	Chart.OverviewLevelLines := 0;
	Chart.FirstVisibleDate := '1/1/2001';
	Columns.Add('Column');
	with Items do
	begin
		AddBar(AddItem('Item 1'),'Task','1/2/2001','1/4/2001',Null,Null);
		AddBar(AddItem('Item 1'),'Task','1/6/2001','1/14/2001',Null,Null);
	end;
end
|
|
559
|
How do I change the tooltip when the cursor hovers the overview area
with G2antt1 do
begin
	Chart.OverviewVisible := EXG2ANTTLib_TLB.exOverviewShowAllVisible;
	Chart.OverviewToolTip := 'Tooltip on the overview';
	Chart.FirstVisibleDate := '1/1/2001';
	Columns.Add('Column');
	with Items do
	begin
		AddBar(AddItem('Item 1'),'Task','1/2/2001','1/4/2001',Null,Null);
		AddBar(AddItem('Item 1'),'Task','1/6/2001','1/14/2001',Null,Null);
	end;
end
|
|
558
|
How do I remove the tooltip when the cursor hovers the overview area
with G2antt1 do
begin
	Chart.OverviewVisible := EXG2ANTTLib_TLB.exOverviewShowAllVisible;
	Chart.OverviewToolTip := '';
	Chart.FirstVisibleDate := '1/1/2001';
	Columns.Add('Column');
	with Items do
	begin
		AddBar(AddItem('Item 1'),'Task','1/2/2001','1/4/2001',Null,Null);
	end;
end
|
|
557
|
How do I change the selection color in the overview area
with G2antt1 do
begin
	Chart.OverviewVisible := EXG2ANTTLib_TLB.exOverviewShowAllVisible;
	Chart.OverviewSelBackColor := $ff;
	Chart.FirstVisibleDate := '1/1/2001';
	Columns.Add('Column');
	with Items do
	begin
		AddBar(AddItem('Item 1'),'Task','1/2/2001','1/4/2001',Null,Null);
	end;
end
|
|
556
|
How do I change the background color for the overview area
with G2antt1 do
begin
	Chart.OverviewVisible := EXG2ANTTLib_TLB.exOverviewShowAllVisible;
	Chart.OverviewBackColor := $ff;
	Chart.FirstVisibleDate := '1/1/2001';
	Columns.Add('Column');
	with Items do
	begin
		AddBar(AddItem('Item 1'),'Task','1/2/2001','1/4/2001',Null,Null);
	end;
end
|
|
555
|
How do I specify the height for the overview area
with G2antt1 do
begin
	Chart.OverviewVisible := EXG2ANTTLib_TLB.exOverviewShowAllVisible;
	Chart.OverviewHeight := 16;
	Chart.FirstVisibleDate := '1/1/2001';
	Columns.Add('Column');
	with Items do
	begin
		AddBar(AddItem('Item 1'),'Task','1/2/2001','1/4/2001',Null,Null);
	end;
end
|
|
554
|
How do I show or hide the control's overview area
with G2antt1 do
begin
	Chart.OverviewVisible := EXG2ANTTLib_TLB.exOverviewShowAllVisible;
	Chart.FirstVisibleDate := '1/1/2001';
	Columns.Add('Column');
	with Items do
	begin
		AddBar(AddItem('Item 1'),'Task','1/2/2001','1/4/2001',Null,Null);
	end;
end
|
|
553
|
How do I enable or disable resizing the bars at runtime
with G2antt1 do
begin
	Chart.BarsAllowSizing := False;
end
|
|
552
|
How do I get the bar from the point or cursor
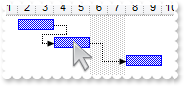
// MouseMove event - Occurs when the user moves the mouse.
procedure TForm1.G2antt1MouseMove(ASender: TObject; Button : Smallint; Shift : Smallint; X : Integer; Y : Integer);
begin
	with G2antt1 do
	begin
		OutputDebugString( ItemFromPoint[-1,-1,c,h] );
		OutputDebugString( Chart.BarFromPoint[-1,-1] );
	end
end;

with G2antt1 do
begin
	BeginUpdate();
	Columns.Add('Task');
	with Chart do
	begin
		FirstVisibleDate := '12/29/2000';
		PaneWidth[False] := 64;
		LevelCount := 2;
	end;
	with Items do
	begin
		h1 := AddItem('Task 1');
		AddBar(h1,'Task','1/2/2001','1/4/2001','K1',Null);
		h2 := AddItem('Task 2');
		AddBar(h2,'Task','1/4/2001','1/6/2001','K2',Null);
		AddLink('L1',h1,'K1',h2,'K2');
		h3 := AddItem('Task 3');
		AddBar(h3,'Task','1/8/2001','1/10/2001','K3',Null);
		AddLink('L2',h2,'K2',h3,'K3');
	end;
	EndUpdate();
end
|
|
551
|
How do I specify the color of pattern for non working days
with G2antt1 do
begin
	Chart.NonworkingDays := 66;
	Chart.NonworkingDaysPattern := EXG2ANTTLib_TLB.exPatternVertical;
	Chart.NonworkingDaysColor := $ff;
end
|
|
550
|
How do I specify the type of pattern for non working days
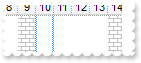
with G2antt1 do
begin
	Chart.NonworkingDays := 66;
	Chart.NonworkingDaysPattern := EXG2ANTTLib_TLB.exPatternBrick;
end
|
|
549
|
How do I specify the non working days
with G2antt1 do
begin
	Chart.NonworkingDays := 66;
end
|
|
548
|
How do I specify the non working days
with G2antt1 do
begin
	Chart.NonworkingDays := 66;
end
|
|
547
|
How do I add a predefined bar

with G2antt1 do
begin
	Chart.Bars.Add('CustomBar').Color := $ff;
	Chart.FirstVisibleDate := '1/1/2001';
	Columns.Add('Column');
	with Items do
	begin
		AddBar(AddItem('Item 1'),'CustomBar','1/2/2001','1/4/2001',Null,Null);
	end;
end
|
|
546
|
How do I change the unit being displayed in the chart
with G2antt1 do
begin
	Chart.PaneWidth[False] := 0;
	Chart.UnitScale := EXG2ANTTLib_TLB.exWeek;
	Chart.UnitWidth := 64;
end
|
|
545
|
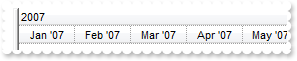
How do I specify the prodefined tooltip being shown on the chart's header, when Zoom method is used
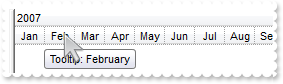
with G2antt1 do
begin
	Chart.PaneWidth[False] := 0;
	Chart.LevelCount := 2;
	Chart.Label[EXG2ANTTLib_TLB.exHalfYear] := '';
	Chart.Label[EXG2ANTTLib_TLB.exQuarterYear] := '';
	Chart.Label[EXG2ANTTLib_TLB.exMonth] := '<%m3%>';
	Chart.LabelToolTip[EXG2ANTTLib_TLB.exMonth] := 'Tooltip: <%mmmm%>';
	Chart.Zoom('1/1/2007','1/1/2008',Null);
	Chart.FirstVisibleDate := '1/1/2007';
end
|
|
544
|
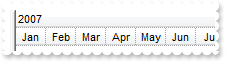
How do I specify the prodefined labels being displayed on the chart, when Zoom method is used
with G2antt1 do
begin
	Chart.PaneWidth[False] := 0;
	Chart.LevelCount := 2;
	Chart.Label[EXG2ANTTLib_TLB.exHalfYear] := '';
	Chart.Label[EXG2ANTTLib_TLB.exQuarterYear] := '';
	Chart.Label[EXG2ANTTLib_TLB.exMonth] := '<%m3%>';
	Chart.Zoom('1/1/2007','1/1/2008',Null);
	Chart.FirstVisibleDate := '1/1/2007';
end
|
|
543
|
How do I scale or zoom the chart to a specified range of date
with G2antt1 do
begin
	Chart.PaneWidth[False] := 0;
	Chart.LevelCount := 2;
	Chart.Label[EXG2ANTTLib_TLB.exHalfYear] := '';
	Chart.Label[EXG2ANTTLib_TLB.exQuarterYear] := '';
	Chart.Label[EXG2ANTTLib_TLB.exMonth] := '<%m3%>';
	Chart.Zoom('1/1/2007','1/1/2008',Null);
	Chart.FirstVisibleDate := '1/1/2007';
end
|
|
542
|
How do I scale or zoom the chart to a specified range of date
with G2antt1 do
begin
	Chart.PaneWidth[False] := 0;
	Chart.LevelCount := 2;
	Chart.Zoom('1/1/2007','7/1/2007',Null);
	Chart.FirstVisibleDate := '1/1/2007';
end
|
|
541
|
How do I find the next date or previous date
with G2antt1 do
begin
	with Chart do
	begin
		FirstVisibleDate := OleVariant(NextDate['1/1/2002',EXG2ANTTLib_TLB.exDay,OleVariant(1)]);
	end;
end
|
|
540
|
How can I change the color for the grid lines in the chart
with G2antt1 do
begin
	Chart.DrawGridLines := EXG2ANTTLib_TLB.exAllLines;
	Chart.LevelCount := 2;
	with Chart.Level[1] do
	begin
		DrawGridLines := True;
		GridLineColor := $ff;
	end;
end
|
|
539
|
How can I draw, show or hide the grid lines in the chart
with G2antt1 do
begin
	Chart.DrawGridLines := EXG2ANTTLib_TLB.exAllLines;
	Chart.LevelCount := 2;
	Chart.Level[1].DrawGridLines := True;
end
|
|
538
|
How do I change the color to highlight the today in the chart
with G2antt1 do
begin
	Chart.MarkTodayColor := $ff;
end
|
|
537
|
How do I hide or stop highlighting the today area in the chart
with G2antt1 do
begin
	with Chart do
	begin
		MarkTodayColor := BackColor;
	end;
end
|
|
536
|
Is there any function to get the date in the format that I use for levels, to layout my chart's header
with G2antt1 do
begin
	h := Chart.FormatDate['1/1/2002','<%yyyy%> <%mmmm%> <%d%> <%dddd%>'];
	Columns.Add(h);
end
|
|
535
|
How can I get the date from the point, cursor
// MouseMove event - Occurs when the user moves the mouse.
procedure TForm1.G2antt1MouseMove(ASender: TObject; Button : Smallint; Shift : Smallint; X : Integer; Y : Integer);
begin
	with G2antt1 do
	begin
		OutputDebugString( Chart.DateFromPoint[-1,-1] );
	end
end;
|
|
534
|
How can I show or hide the small ticker that shows up when the cursor hovers the chart area
with G2antt1 do
begin
	Chart.DrawDateTicker := True;
end
|
|
533
|
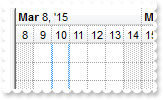
How can I change the first visible date in the chart
with G2antt1 do
begin
	Chart.LevelCount := 2;
	Chart.FirstVisibleDate := '1/1/2002';
end
|
|
532
|
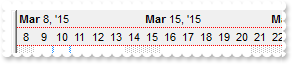
How can I scroll or ensure that a specified date time is visible in the chart
with G2antt1 do
begin
	Chart.LevelCount := 2;
	Chart.FirstVisibleDate := '1/1/2002';
end
|
|
531
|
How can I scroll or ensure that a specified date time is visible to the right side of the chart or control
with G2antt1 do
begin
	Chart.LevelCount := 2;
	Chart.ScrollTo('1/1/2002',OleVariant(2));
end
|
|
530
|
How can I scroll or ensure that a specified date time is visible
with G2antt1 do
begin
	Chart.LevelCount := 2;
	Chart.ScrollTo('1/1/2002',OleVariant(2));
end
|
|
529
|
How can I show or hide the the tooltip being shown when the user scrolls the chart
with G2antt1 do
begin
	Chart.ToolTip := '';
end
|
|
528
|
How can I change the format of the tooltip when the user scrolls the chart
with G2antt1 do
begin
	Chart.ToolTip := 'ToolTip: <b><%dddd%></b>';
end
|
|
527
|
How can I hide the chart's scroll bar
with G2antt1 do
begin
	Chart.ScrollBar := False;
end
|
|
526
|
How can I specify the first day of the week
with G2antt1 do
begin
	Chart.LevelCount := 2;
	Chart.FirstWeekDay := EXG2ANTTLib_TLB.exMonday;
end
|
|
525
|
How do I change the AM or PM shortcuts in the chart's header
with G2antt1 do
begin
	Chart.UnitWidth := 64;
	Chart.AMPM := 'A P';
	with Chart.Level[0] do
	begin
		Label := '<%h%> <%AM/PM%>';
		Unit := EXG2ANTTLib_TLB.exHour;
	end;
end
|
|
524
|
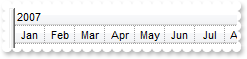
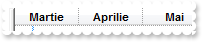
How do I change the name for the months, being displayed in the chart's header
with G2antt1 do
begin
	Chart.UnitWidth := 64;
	Chart.MonthNames := 'Ianuarie Februarie Martie Aprilie Mai Iunie Iulie August Septembrie Octombrie Noiembrie Decembrie';
	with Chart.Level[0] do
	begin
		Label := '<b><%mmmm%></b>';
		Unit := EXG2ANTTLib_TLB.exMonth;
	end;
end
|
|
523
|
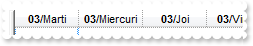
How do I change the name for the week days, being displayed in the chart's header
with G2antt1 do
begin
	Chart.UnitWidth := 64;
	Chart.WeekDays := 'Duminica Luni Marti Miercuri Joi Vineri Simbata';
	Chart.Level[0].Label := '<b><%mm%></b>/<%dddd%>';
end
|
|
522
|
How do I access a level in the chart's header
with G2antt1 do
begin
	Chart.UnitWidth := 64;
	Chart.Level[0].Label := '<b><%mm%></b>/<%dd%>';
end
|
|
521
|
How can I change the color for the grid lines between the leves in the chart's header
with G2antt1 do
begin
	GridLineColor := RGB(255,0,0);
	Chart.LevelCount := 2;
end
|
|
520
|
How can I show or hide the grid lines between the leves in the chart's header
with G2antt1 do
begin
	GridLineColor := RGB(255,0,0);
	with Chart do
	begin
		LevelCount := 2;
		Level[0].DrawTickLines := EXG2ANTTLib_TLB.exLevelNoLine;
		Level[1].DrawTickLines := EXG2ANTTLib_TLB.exLevelNoLine;
	end;
end
|
|
519
|
How do I change the foreground color for the chart's header
with G2antt1 do
begin
	Chart.ForeColorLevelHeader := $ff;
end
|
|
518
|
How do I change the background color for the chart's header
with G2antt1 do
begin
	Chart.BackColorLevelHeader := $ff;
end
|
|
517
|
How do I specify the chart's foreground color
with G2antt1 do
begin
	Chart.ForeColor := $ff;
end
|
|
516
|
How do I specify the chart's background color
with G2antt1 do
begin
	Chart.BackColor := $ff;
end
|
|
515
|
How do I put a picture on the center of the chart
with G2antt1 do
begin
	Chart.Picture := G2antt1.ExecuteTemplate('loadpicture(`c:\exontrol\images\zipdisk.gif`)');
	Chart.PictureDisplay := EXG2ANTTLib_TLB.MiddleCenter;
end
|
|
514
|
How do I resize/stretch a picture on the chart's background
with G2antt1 do
begin
	Chart.Picture := G2antt1.ExecuteTemplate('loadpicture(`c:\exontrol\images\zipdisk.gif`)');
	Chart.PictureDisplay := EXG2ANTTLib_TLB.Stretch;
end
|
|
513
|
How do I put a picture on the chart's center right bottom side
with G2antt1 do
begin
	Chart.Picture := G2antt1.ExecuteTemplate('loadpicture(`c:\exontrol\images\zipdisk.gif`)');
	Chart.PictureDisplay := EXG2ANTTLib_TLB.LowerRight;
end
|
|
512
|
How do I put a picture on the chart's center left bottom side
with G2antt1 do
begin
	Chart.Picture := G2antt1.ExecuteTemplate('loadpicture(`c:\exontrol\images\zipdisk.gif`)');
	Chart.PictureDisplay := EXG2ANTTLib_TLB.LowerLeft;
end
|
|
511
|
How do I put a picture on the chart's center top side
with G2antt1 do
begin
	Chart.Picture := G2antt1.ExecuteTemplate('loadpicture(`c:\exontrol\images\zipdisk.gif`)');
	Chart.PictureDisplay := EXG2ANTTLib_TLB.UpperCenter;
end
|
|
510
|
How do I put a picture on the chart's right top corner
with G2antt1 do
begin
	Chart.Picture := G2antt1.ExecuteTemplate('loadpicture(`c:\exontrol\images\zipdisk.gif`)');
	Chart.PictureDisplay := EXG2ANTTLib_TLB.UpperRight;
end
|
|
509
|
How do I put a picture on the chart's left top corner
with G2antt1 do
begin
	Chart.Picture := G2antt1.ExecuteTemplate('loadpicture(`c:\exontrol\images\zipdisk.gif`)');
	Chart.PictureDisplay := EXG2ANTTLib_TLB.UpperLeft;
end
|
|
508
|
How do I put a picture on the chart's background
with G2antt1 do
begin
	Chart.Picture := G2antt1.ExecuteTemplate('loadpicture(`c:\exontrol\images\zipdisk.gif`)');
end
|
|
507
|
How to specify the width for the left or side pane
with G2antt1 do
begin
	Chart.PaneWidth[False] := 128;
end
|
|
506
|
How do I display the header of the chart using multiple levels, lines
with G2antt1 do
begin
	Chart.LevelCount := 2;
end
|
|
505
|
How do change the width of the chart's area
with G2antt1 do
begin
	Chart.PaneWidth[True] := 256;
end
|
|
504
|
How do I show or hide the control's chart area
with G2antt1 do
begin
	Chart.PaneWidth[True] := 0;
end
|
|
503
|
How do I access the chart's area of the control
with G2antt1 do
begin
	Chart.PaneWidth[False] := 64;
end
|
|
502
|
How can I select a cells like in excel
with G2antt1 do
begin
	SingleSel := False;
	FullRowSelect := EXG2ANTTLib_TLB.exRectSel;
	MarkSearchColumn := False;
	SearchColumnIndex := -1;
	Columns.Add('Column1');
	Columns.Add('Column2');
	Columns.Add('Column3');
	with Items do
	begin
		DefaultItem := AddItem(OleVariant(0));
		CellValue[OleVariant(0),OleVariant(1)] := OleVariant(1);
		CellValue[OleVariant(0),OleVariant(2)] := OleVariant(2);
		DefaultItem := AddItem(OleVariant(3));
		CellValue[OleVariant(0),OleVariant(1)] := OleVariant(4);
		CellValue[OleVariant(0),OleVariant(2)] := OleVariant(5);
		DefaultItem := AddItem(OleVariant(6));
		CellValue[OleVariant(0),OleVariant(1)] := OleVariant(7);
		CellValue[OleVariant(0),OleVariant(2)] := OleVariant(8);
	end;
end
|
|
501
|
How can I select a multiple column
with G2antt1 do
begin
	MarkSearchColumn := False;
	SingleSel := False;
	FullRowSelect := EXG2ANTTLib_TLB.exRectSel;
	(IUnknown(Columns.Add('Column1')) as EXG2ANTTLib_TLB.Column).Selected := True;
	Columns.Add('Column2');
	(IUnknown(Columns.Add('Column3')) as EXG2ANTTLib_TLB.Column).Selected := True;
	with Items do
	begin
		DefaultItem := AddItem(OleVariant(0));
		CellValue[OleVariant(0),OleVariant(1)] := OleVariant(1);
		CellValue[OleVariant(0),OleVariant(2)] := OleVariant(2);
		DefaultItem := AddItem(OleVariant(3));
		CellValue[OleVariant(0),OleVariant(1)] := OleVariant(4);
		CellValue[OleVariant(0),OleVariant(2)] := OleVariant(5);
		DefaultItem := AddItem(OleVariant(6));
		CellValue[OleVariant(0),OleVariant(1)] := OleVariant(7);
		CellValue[OleVariant(0),OleVariant(2)] := OleVariant(8);
	end;
	Items.SelectAll();
end
|